Animating a melody as a mathematical object#
CopenhagenR - useR Group meetup 2024
This is an exploratory project beginning with the thought that given music can be digitised, there must be a way to translate it to a dataframe in R, and then wrangle to something that can be transformed to a graph, plotted using ggraph, and finally animated with gganimate.
The melody#
As is only right and proper, I used the subject of Contrapunctus I from J.S. Bach’s The Art of Fugue, a towering study of melody by the composer who defined the rules of melody.

(Image source: wikipedia)
Happily, wikipedia provides the midi along with the image of melody.
The math#
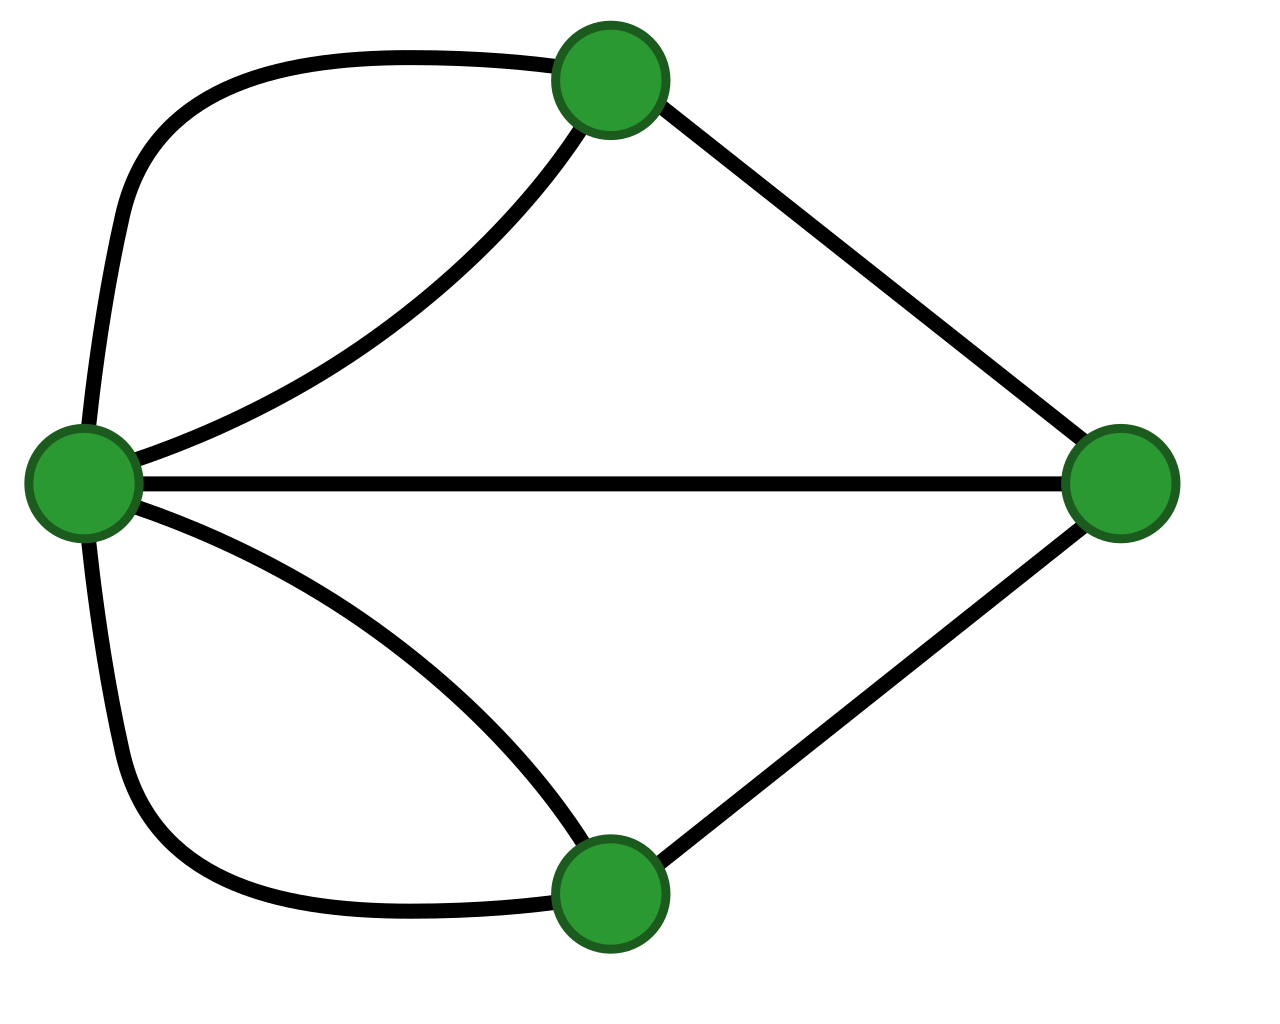
It’s impossible to talk about graphs without beginning with Euler’s solution to The Seven Bridges of Konigsberg problem, where the puzzle was to find a walking path through the city that crosses each of its seven bridges exactly once. Euler invented graph theory to show it could not be done.
A graph comprises a set of nodes, and a set of edges, where each edge is a set of two nodes. The brilliance of Euler’s solution was to realise the size and shape of the landmasses were irrelevant, only the the bridges (edges) between them.

(Image source: wikipedia)
The code#
To animate a midi as a graph, I took these steps:
Convert midi to R object using
pyramidi.Create melody dataframe.
Use
gtto make a table of notes.tidygraphgraph of notes.ggraphplot.gganimategraph plot.Add audio.
In the next sections, I describe each step in more detail.