
ggraph plot#
A graph object can be readily passed to ggraph.
melody_graph <- readRDS(url('https://github.com/softloud/digmus/raw/main/outputs/step-output/melody_graph.rds'))
library(ggraph)

melody_graph |>
        ggraph(layout = 'linear') +
        geom_edge_arc(aes(group = note)) +
        geom_edge_point()
Loading required package: ggplot2
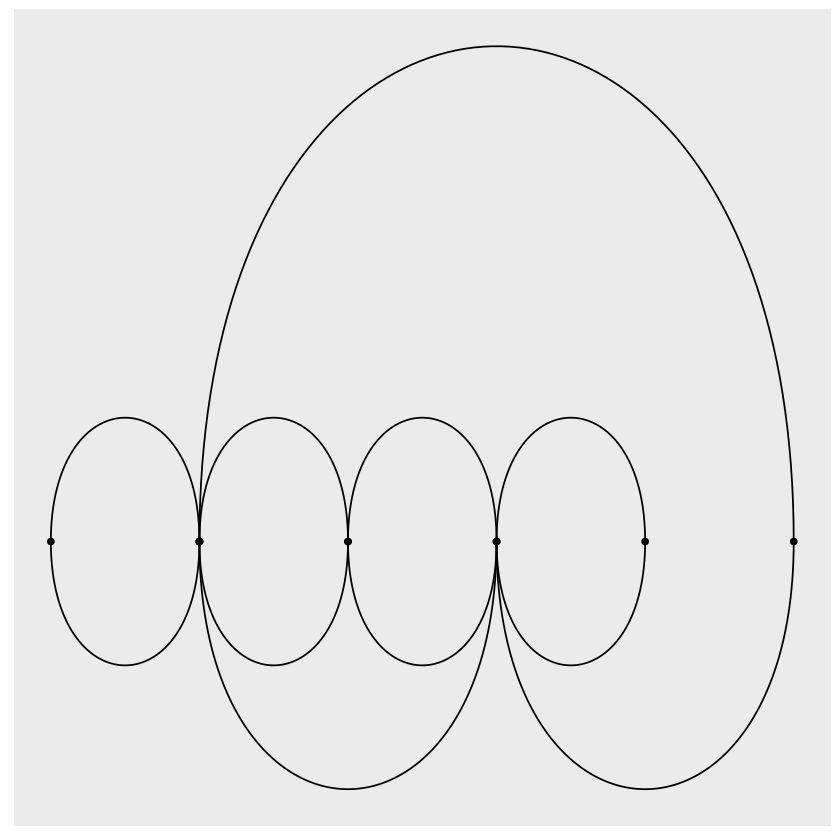
And with some bits and pieces for background, point size, colour, etc., we have a labelled graph of the melody.
