GEUS Application

Charles T. Gray

Ph.D. (Statistics) Towards a Measure of Codeproof: a toolchain walkthrough for computationally developing a statistical estimator

R Presentation tools

# tools used to make 
# this Quarto presentation

# render images
library(knitr) 

# data science
library(tidyverse)

# html tables
library(gt) 

My tools

# install examples  
library(devtools)

# living analysis
install_github("spunk") 

# meta-anaysis simulation
install_github("simeta") 

Why did I apply?

FAIR and Open Science

spunk package

Nutritional interventions for male infertility: a systematic review and meta-analysis

Open spunk data

Machine-readable data

library(spunk)

# data used in previous visualisation
spunk_dat %>% 
    filter(outcome == "morphology") %>% 
    sample_n(5) %>% 
    gt()
outcome intervention class moderator study control intervention_mean intervention_sd intervention_n control_mean control_sd control_n
morphology Folic acid Vitamins idiopathic Silva 2013 Placebo/no treatment 23.91 3.68 23 24.23 3.06 26
morphology Selenium Minerals asthenoteratozoospermia Safarinejad 2009b Placebo/no treatment 9.30 2.90 104 7.20 2.60 106
morphology Magnesium Minerals oligozoospermia Zavaczki 2003 Placebo/no treatment 57.20 12.50 10 42.80 14.80 10
morphology Vitamin C + Vitamin E Vitamins oligoasthenoteratozoospermia Greco 2005 Placebo/no treatment 8.00 7.10 32 11.60 7.80 32
morphology Lycopene Antioxidants oligoasthenoteratozoospermia Nouri 2019 Placebo/no treatment 1.88 0.99 17 1.78 1.08 19

Code I’m proud of

Simulating meta-analysis data

I have a question about simeta - I need to simulate meta-analyses with large, medium and small effect sizes and with high, medium and low heterogenity to illustrate the point about why vote-counting does not work (in all but the most extreme cases - large effect and no heterogenity). Can I do this using the code from simeta?

Uh, I don’t know

What I did

A brutally honest account.

  • Procrastinated about responding
  • Unchecked Bullet Journal task
  • Set a meeting
  • Opened Pandora’s Box (cloned repo)
  • Check build
  • Use-cases
  • Meeting codejam

Packaged analysis: simeta

simeta

Math is in the manuscript, Statistics and Data Science, 2019

library(simeta)

# simulate dataset of 3 studies
example_meta <- sim_stats(
  measure = "mean",
  measure_spread = "sd",
  n_df = sim_n(), 
  wide = TRUE, # metafor interoperability
  rdist = "lnorm",   # sampling distribution
  par = list(shape = 0.25, scale = 1),
  tau_sq = 0.4, # between-study error
  effect_ratio = 1.2 # true effect 
) 
# output in html using quarto
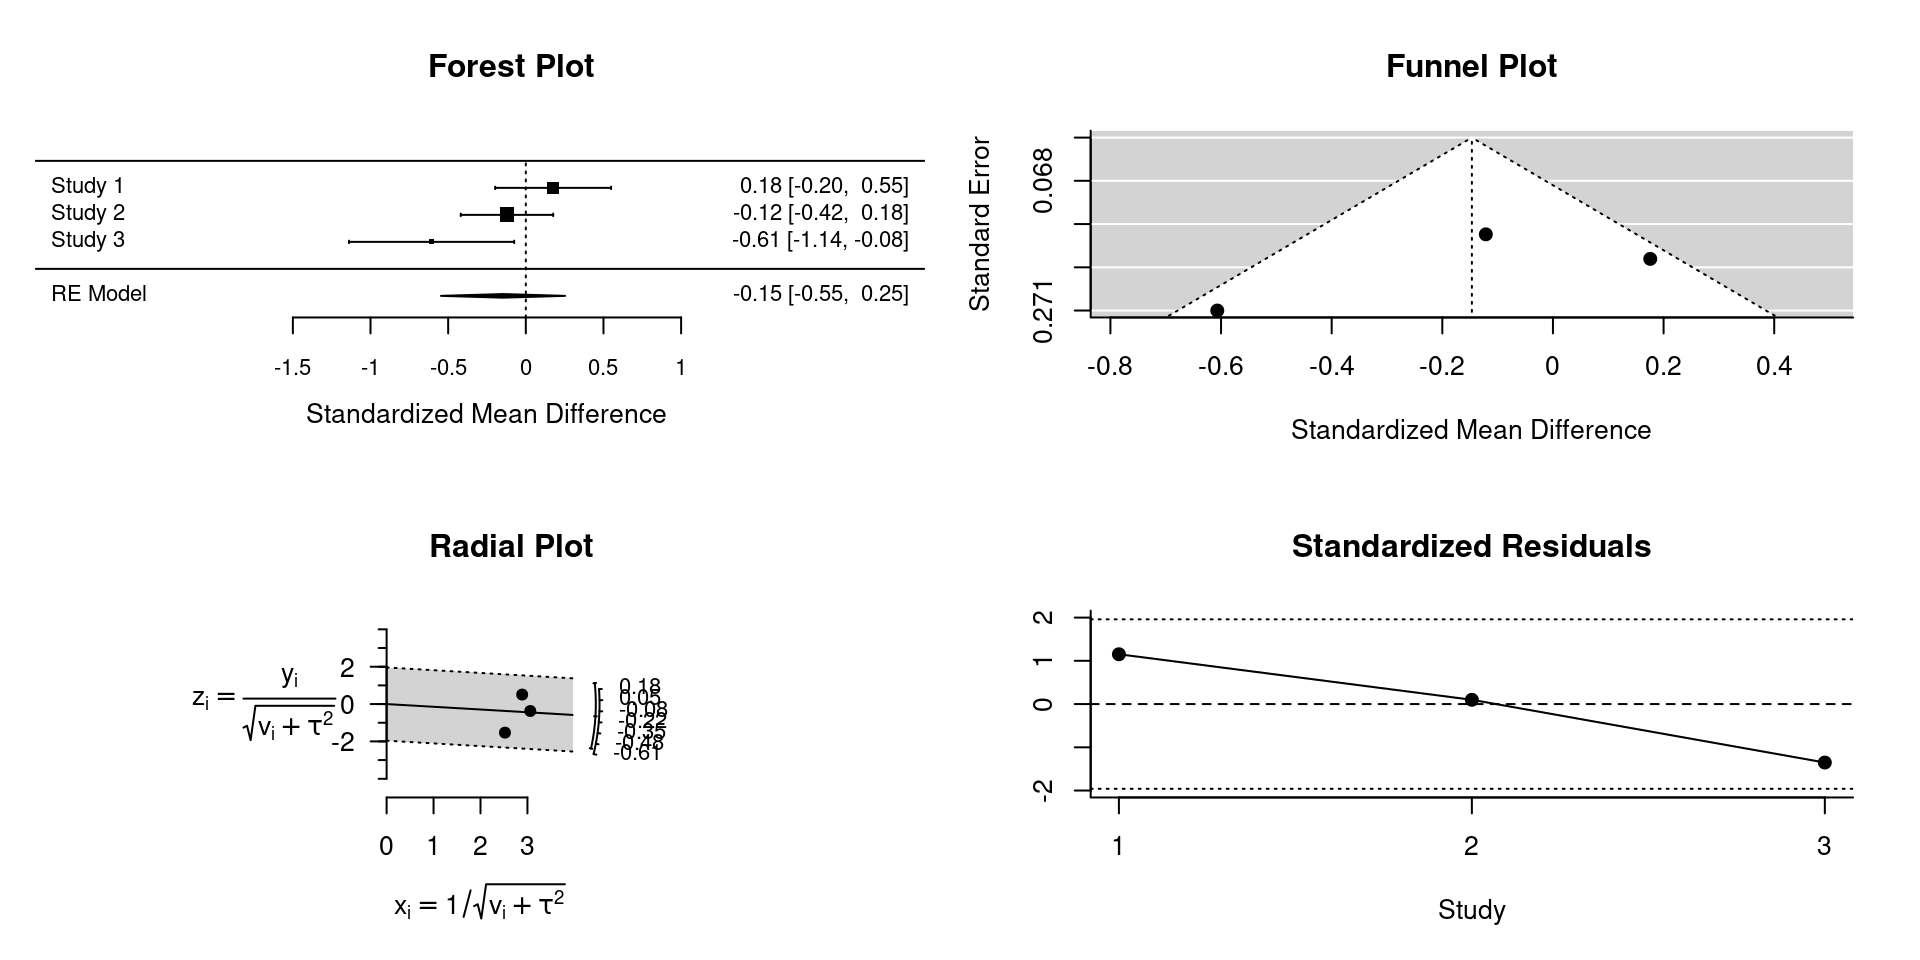
example_meta %>% gt()
study effect_c effect_spread_c n_c effect_i effect_spread_i n_i
Elphir_1984 2.549209 2.727634 54 2.131478 1.944986 57
Imrazôr_1992 2.605021 3.322262 86 3.071742 4.267402 88
Yavanna_2015 1.749192 1.718549 30 3.973773 4.935866 27

What is a meta-analysis?

library(metafor)

# random-effects meta-analysis
rma(
    data = example_meta,
    measure = "SMD",
    m1i = effect_c,
    sd1i = effect_spread_c,
    n1i = n_c,
    m2i = effect_i,
    sd2i = effect_spread_i,
    n2i = n_i
) -> rma_example

What is a meta-analysis?

plot(rma_example)

How was simeta implemented?

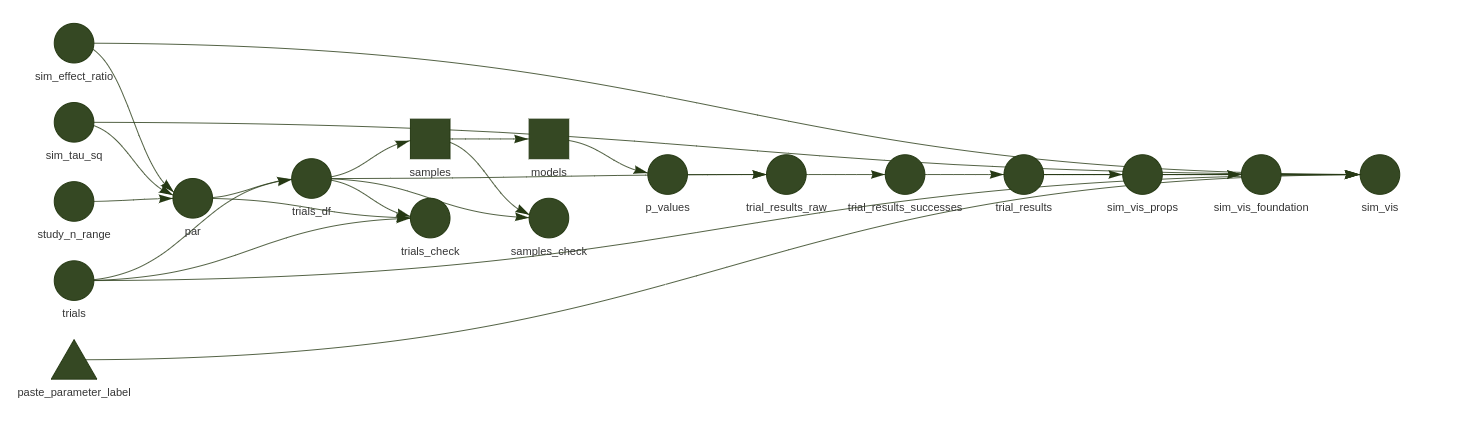
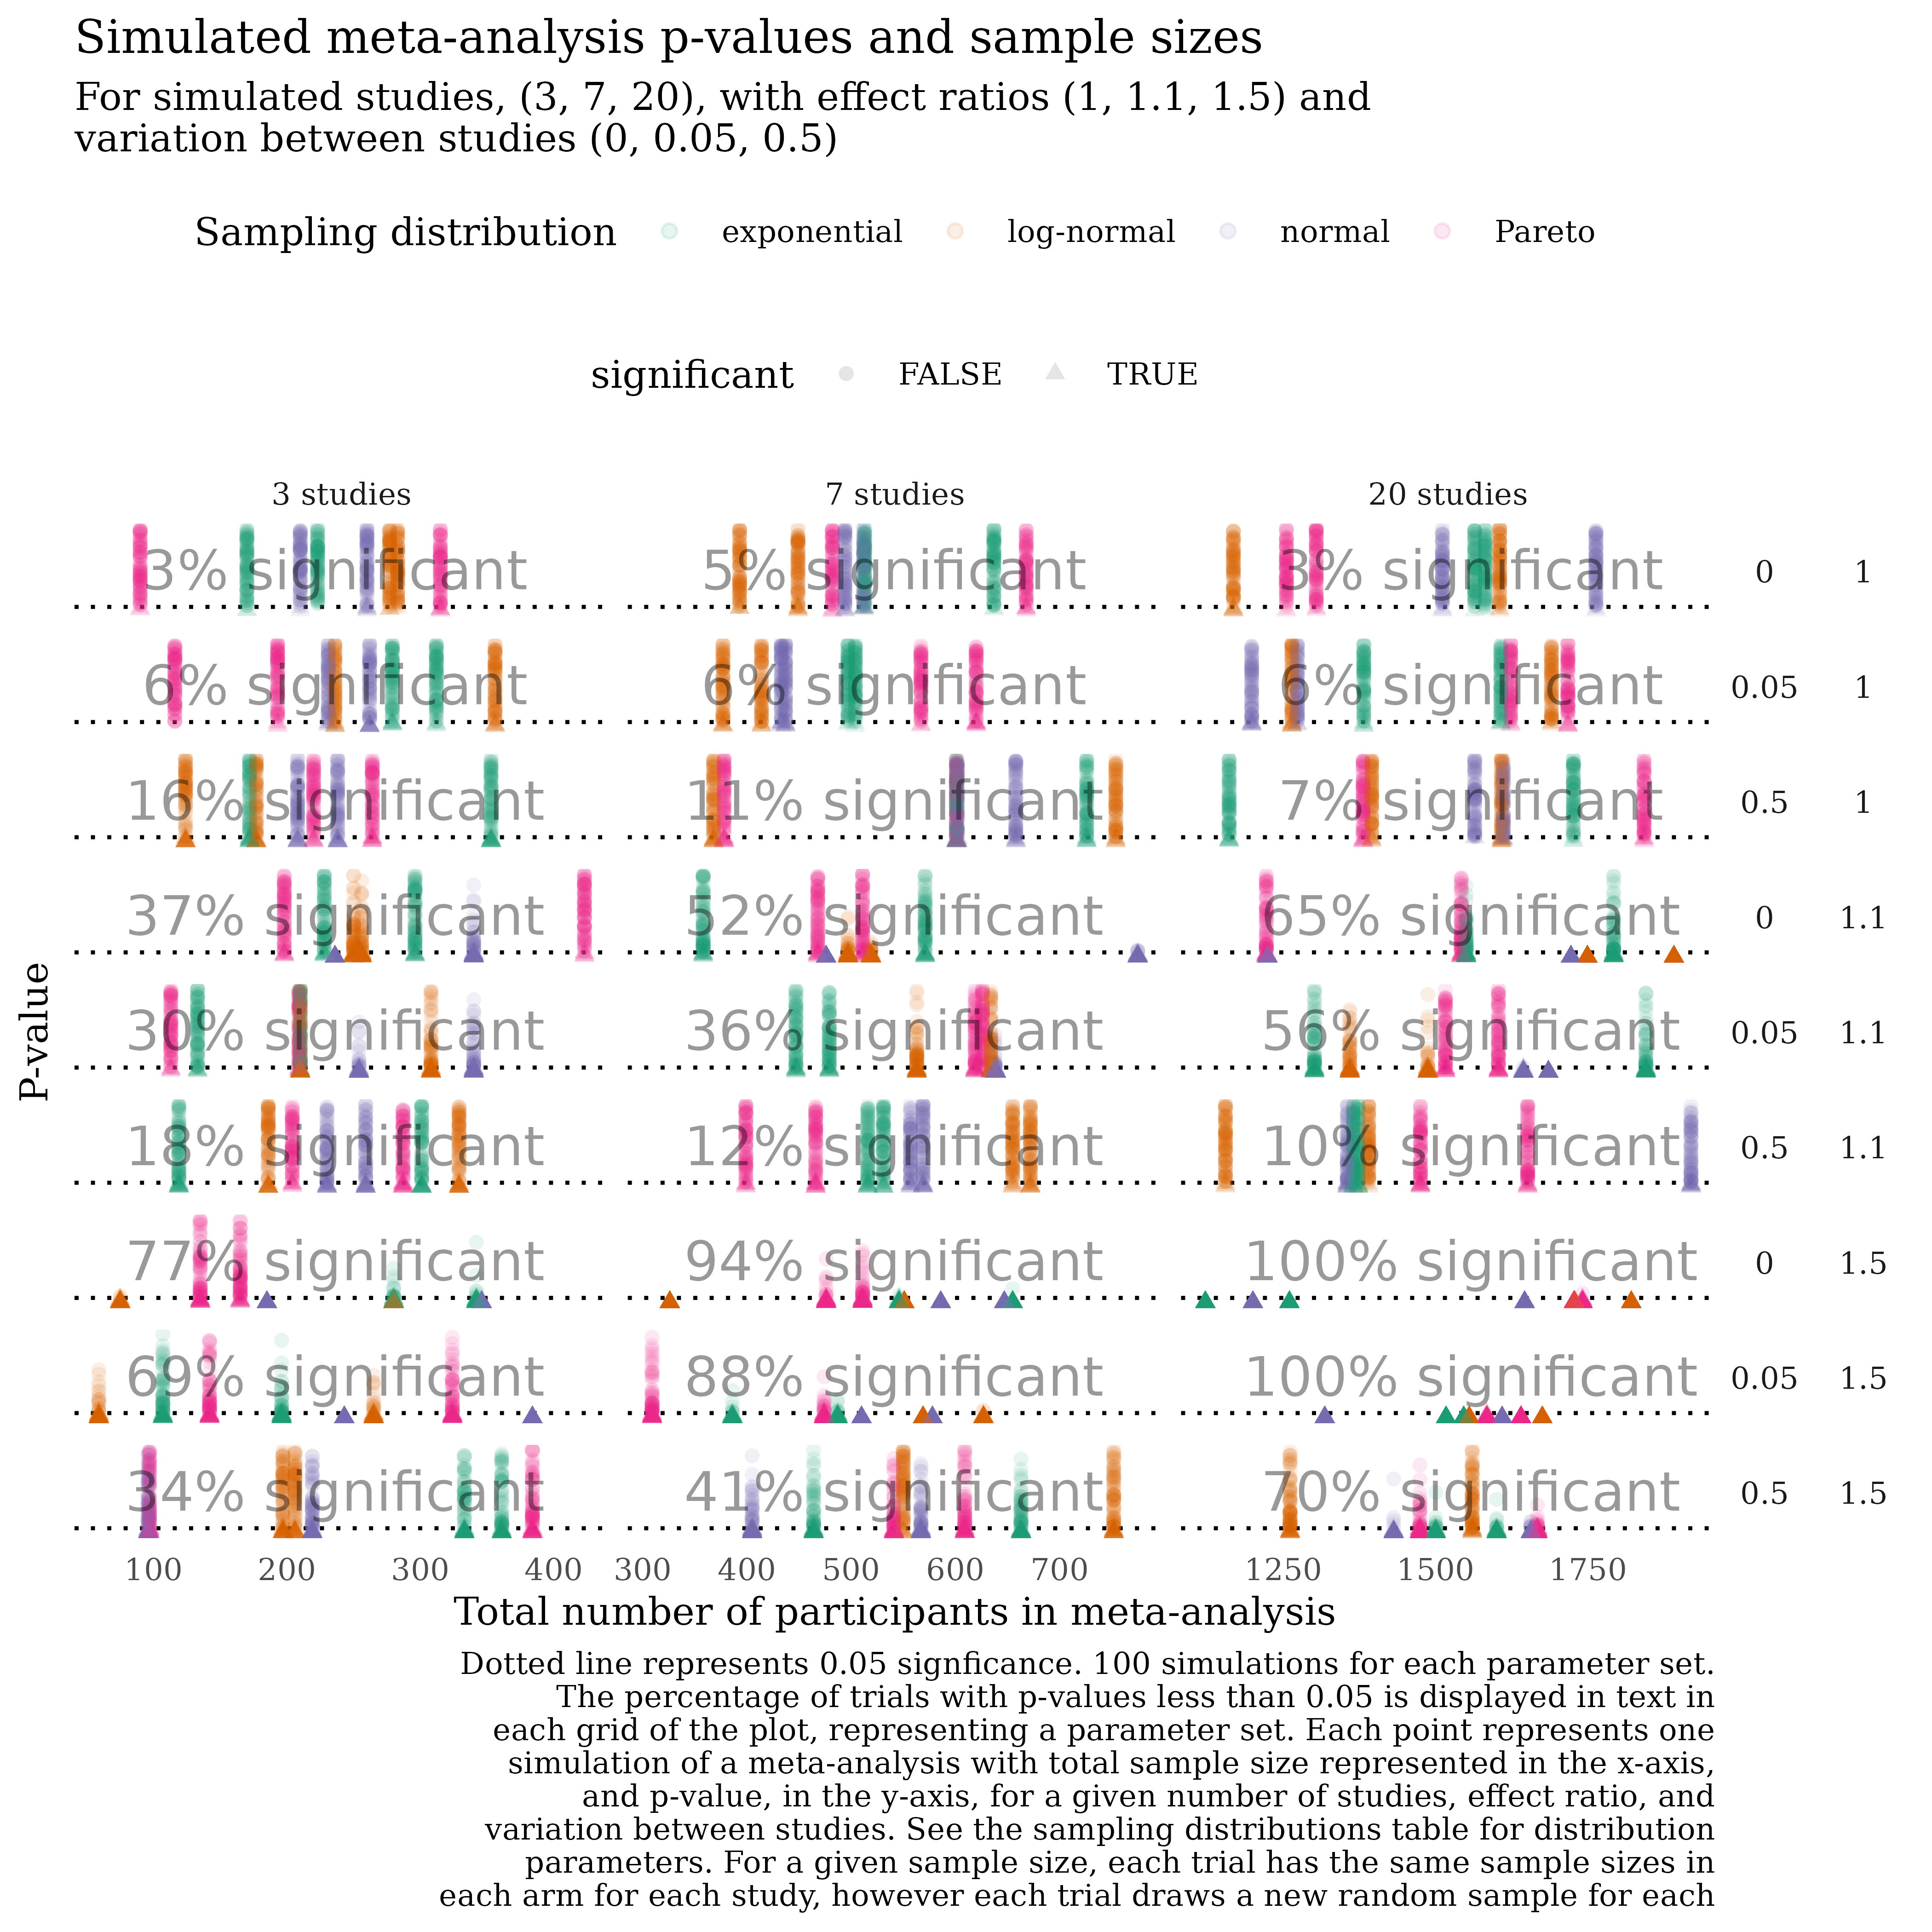
Pipeline to fit 25K meta-analysis models to simulated data, with parameters of interest extracted into a summarised in a ggplot visualisation.

  • metafor models
  • tidyverse tools
  • roxygen documentation
  • pkgdown site deployed on github pages
  • targets simulation pipeline

What does it do?

Tak fordi du lyttede