Code
library(tidyverse)library(tidyverse)Playsession highlights: found out I can run zork from VSC’s terminal, data capture needs to be done in googlesheets for ease of categorical variable handling.
So now I need better data capture than editing the raw tsv, and a better way of organising my code. Currently I have data in zork/data.
Already I see I need to split the data into two datasets. One where each row is uniquely defined by node
read_tsv(
  paste0(here::here(), '/raw_data/zork-nodes.tsv'),
  show_col_types = FALSE) %>%
  head() |> # why has my keybinding for pipe stopped working? argh
gt::gt()| perspective_location | region | interactivity |
|---|---|---|
| west of house | forest | mailbox |
| north of house | forest | NA |
| forest path | forest | NA |
| clearing | forest | pile of leaves |
| clearing | forest | NA |
| behind house | house | window |
and one where each row is uniquely defined by edge.
read_tsv(
  paste0(here::here(), '/raw_data/zork-edges.tsv'),
  show_col_types = FALSE) %>%
  head() |>
gt::gt()| perspective_location | perspective_to_target | target_location | playthrough |
|---|---|---|---|
| west of house | north | north of house | 2024-10-22 |
| north of house | north | forest path | 2024-10-22 |
| forest path | north | clearin | 2024-10-22 |
| clearing | north | forest | 2024-10-22 |
| clearing | east | forest | 2024-10-22 |
| clearing | west | forest | 2024-10-22 |
No doubt there will be other things. (Do I need a dataset for region?)
I will create a new dataset for this, but use the original Playsession as the template.
# Create sets required for graph object
source('init-graph.R')

# Created an empty dataframe for edges

zork_edges
# A tibble: 0 × 3
# ℹ 3 variables: perspective_location <chr>, perspective_to_target <chr>,
# target_location <chr># Created an empty dataframe for nodes
zork_nodes# A tibble: 0 × 4
# ℹ 4 variables: perspective_location <chr>, region <chr>, interactivity <chr>,
# loot <chr>I could do something fancy, but I think I’ll go with add_row to update the data. Let’s add one row for the start.
# Set levels of columns

source('set-levels.R')

# Define a custom print function
print_vector <- function(name, vector) {
  cat(name, ":\n", paste(vector, collapse = ", "), "\n\n")
}# Define the dimensions of the matrix (e.g., 2 rows and 3 columns)
n_cols <- 4
n_rows <- ceiling(length(locations) / n_cols)
# Create an empty matrix with the specified dimensions and fill it row-wise
# Suppressed warning because ragged length of vector, i.e., no guarantee it will
# fill out matrix
locations_matrix <- matrix(locations, nrow = n_rows, ncol = n_cols, byrow = TRUE)
# Print the matrix
locations_matrix [,1] [,2] [,3] [,4]
[1,] "unexplored" "west of house" "north of house" "forest"
[2,] "clearing" "forest path" "behind house" "south of house"
[3,] "kitchen" "living room" "attic" "canyon view"
[4,] "rocky ledge" "cellar" "inaccessible" "east of chasm"
[5,] "gallery" "studio" "the troll room" "maze"
[6,] "east west passageway" "unexplored" "west of house" "north of house"# Print regions
print_vector("Regions", regions)Regions :
unexplored, forest, house, cellar # Print directions
print_vector("Directions", directions)Directions :
north, south, east, west, up, down unknown = 'unknown'
source('set-nodes.R')
zork_nodes# A tibble: 21 × 4
perspective_location region interactivity loot
<chr> <chr> <chr> <chr>
1 west of house forest solved: mailbox leaflet
2 north of house forest none none
3 forest forest song bird? none
4 clearing forest unsolved: pile of leaves none
5 forest path forest none none
6 behind house forest window to house none
7 south of house forest none none
8 kitchen house sack water, lunch, garlic
9 living room house rug, locked door to west sword, lantern
10 attic house none rope, knife
# ℹ 11 more rowssource('set-edges.R')
zork_edges# A tibble: 29 × 3
perspective_location perspective_to_target target_location
<chr> <chr> <chr>
1 west of house north north of house
2 west of house west forest
3 forest north clearing
4 clearing west forest
5 clearing south forest path
6 forest path south north of house
7 north of house east behind house
8 behind house south south of house
9 south of house south forest
10 behind house west kitchen
# ℹ 19 more rowsI wonder if I can join the nodes dataframe to the nodes of the ggraph object?
library(tidygraph)get_zork_graph <- function(zork_edges, zork_nodes, selected_region='all') {
if (selected_region != 'all') {
zork_nodes <- zork_nodes |> filter(region %in% c(selected_region, 'unexplored'))
}
zork_base_graph <-
zork_edges |>
mutate(
from = perspective_location,
to = target_location
) |>
# does order matter?
select(from, to, everything()) |>
as_tbl_graph()
# Join the nodes data frame to the nodes of the graph
zork_graph <- zork_base_graph |>
activate(nodes) |>
# add attributes to nodes
inner_join(zork_nodes, by = c("name" = "perspective_location"))
return(zork_graph)
}zork_cellar <- get_zork_graph(zork_edges, zork_nodes |> filter(region %in% c('cellar', 'unexplored')))
zork_graph <- get_zork_graph(zork_edges, zork_nodes)library(ggraph)
install.packages("viridis")
library(viridis)
library(RColorBrewer)
n_regions <- length(regions)
# cols_f <- colorRampPalette(RColorBrewer::brewer.pal(8, 'Dark2'))
cols_f <- viridis::viridis_pal(option = "D")
zork_paths <- function(zork_graph) {
zork_graph |>
ggraph() +
# configure edges
geom_edge_fan(aes(label = perspective_to_target),
alpha = 0.2,
angle_calc = 'along',
label_colour = 'grey',
label_dodge = unit(2.5, 'mm'),
colour = 'white',
family = 'Courier',
arrow = arrow(length = unit(2, 'mm')),
end_cap = circle(1, 'cm')) +
# configure nodes
geom_node_label(
aes(label = name, fill=region),
colour = 'white',
family = 'Courier',
alpha = 0.3
) +
# configure styling
theme_minimal() +
scale_edge_colour_manual(values = cols_f(n_regions)) +
scale_colour_manual(values = cols_f(n_regions)) +
theme(
plot.background = element_rect(fill = "#333333", colour = NA),
legend.position = 'right',
text = element_text(family = "Courier", size = 20),
axis.ticks = element_blank(),
axis.text = element_blank(),
panel.grid = element_blank(),
plot.title = element_text(colour = 'white'),
plot.subtitle = element_text(colour = 'white'),
plot.caption = element_text(colour = 'white'),
legend.text = element_text(colour = 'white'),
plot.margin = margin(10, 10, 10, 10) # Adjust plot margins
) +
scale_x_continuous(expand = expansion(mult = 0.2)) + # Add space around x-axis
scale_y_continuous(expand = expansion(mult = 0.2)) + # Add space around y-axis
# configure text
labs(
title = "Paths of Zork",
subtitle = "Playsession 3 (2024-10-26)",
caption = "Angle of edge determined by ggraph, not direction",
x = "",
y = "",
colour = 'white'
)
}zork_paths(zork_graph)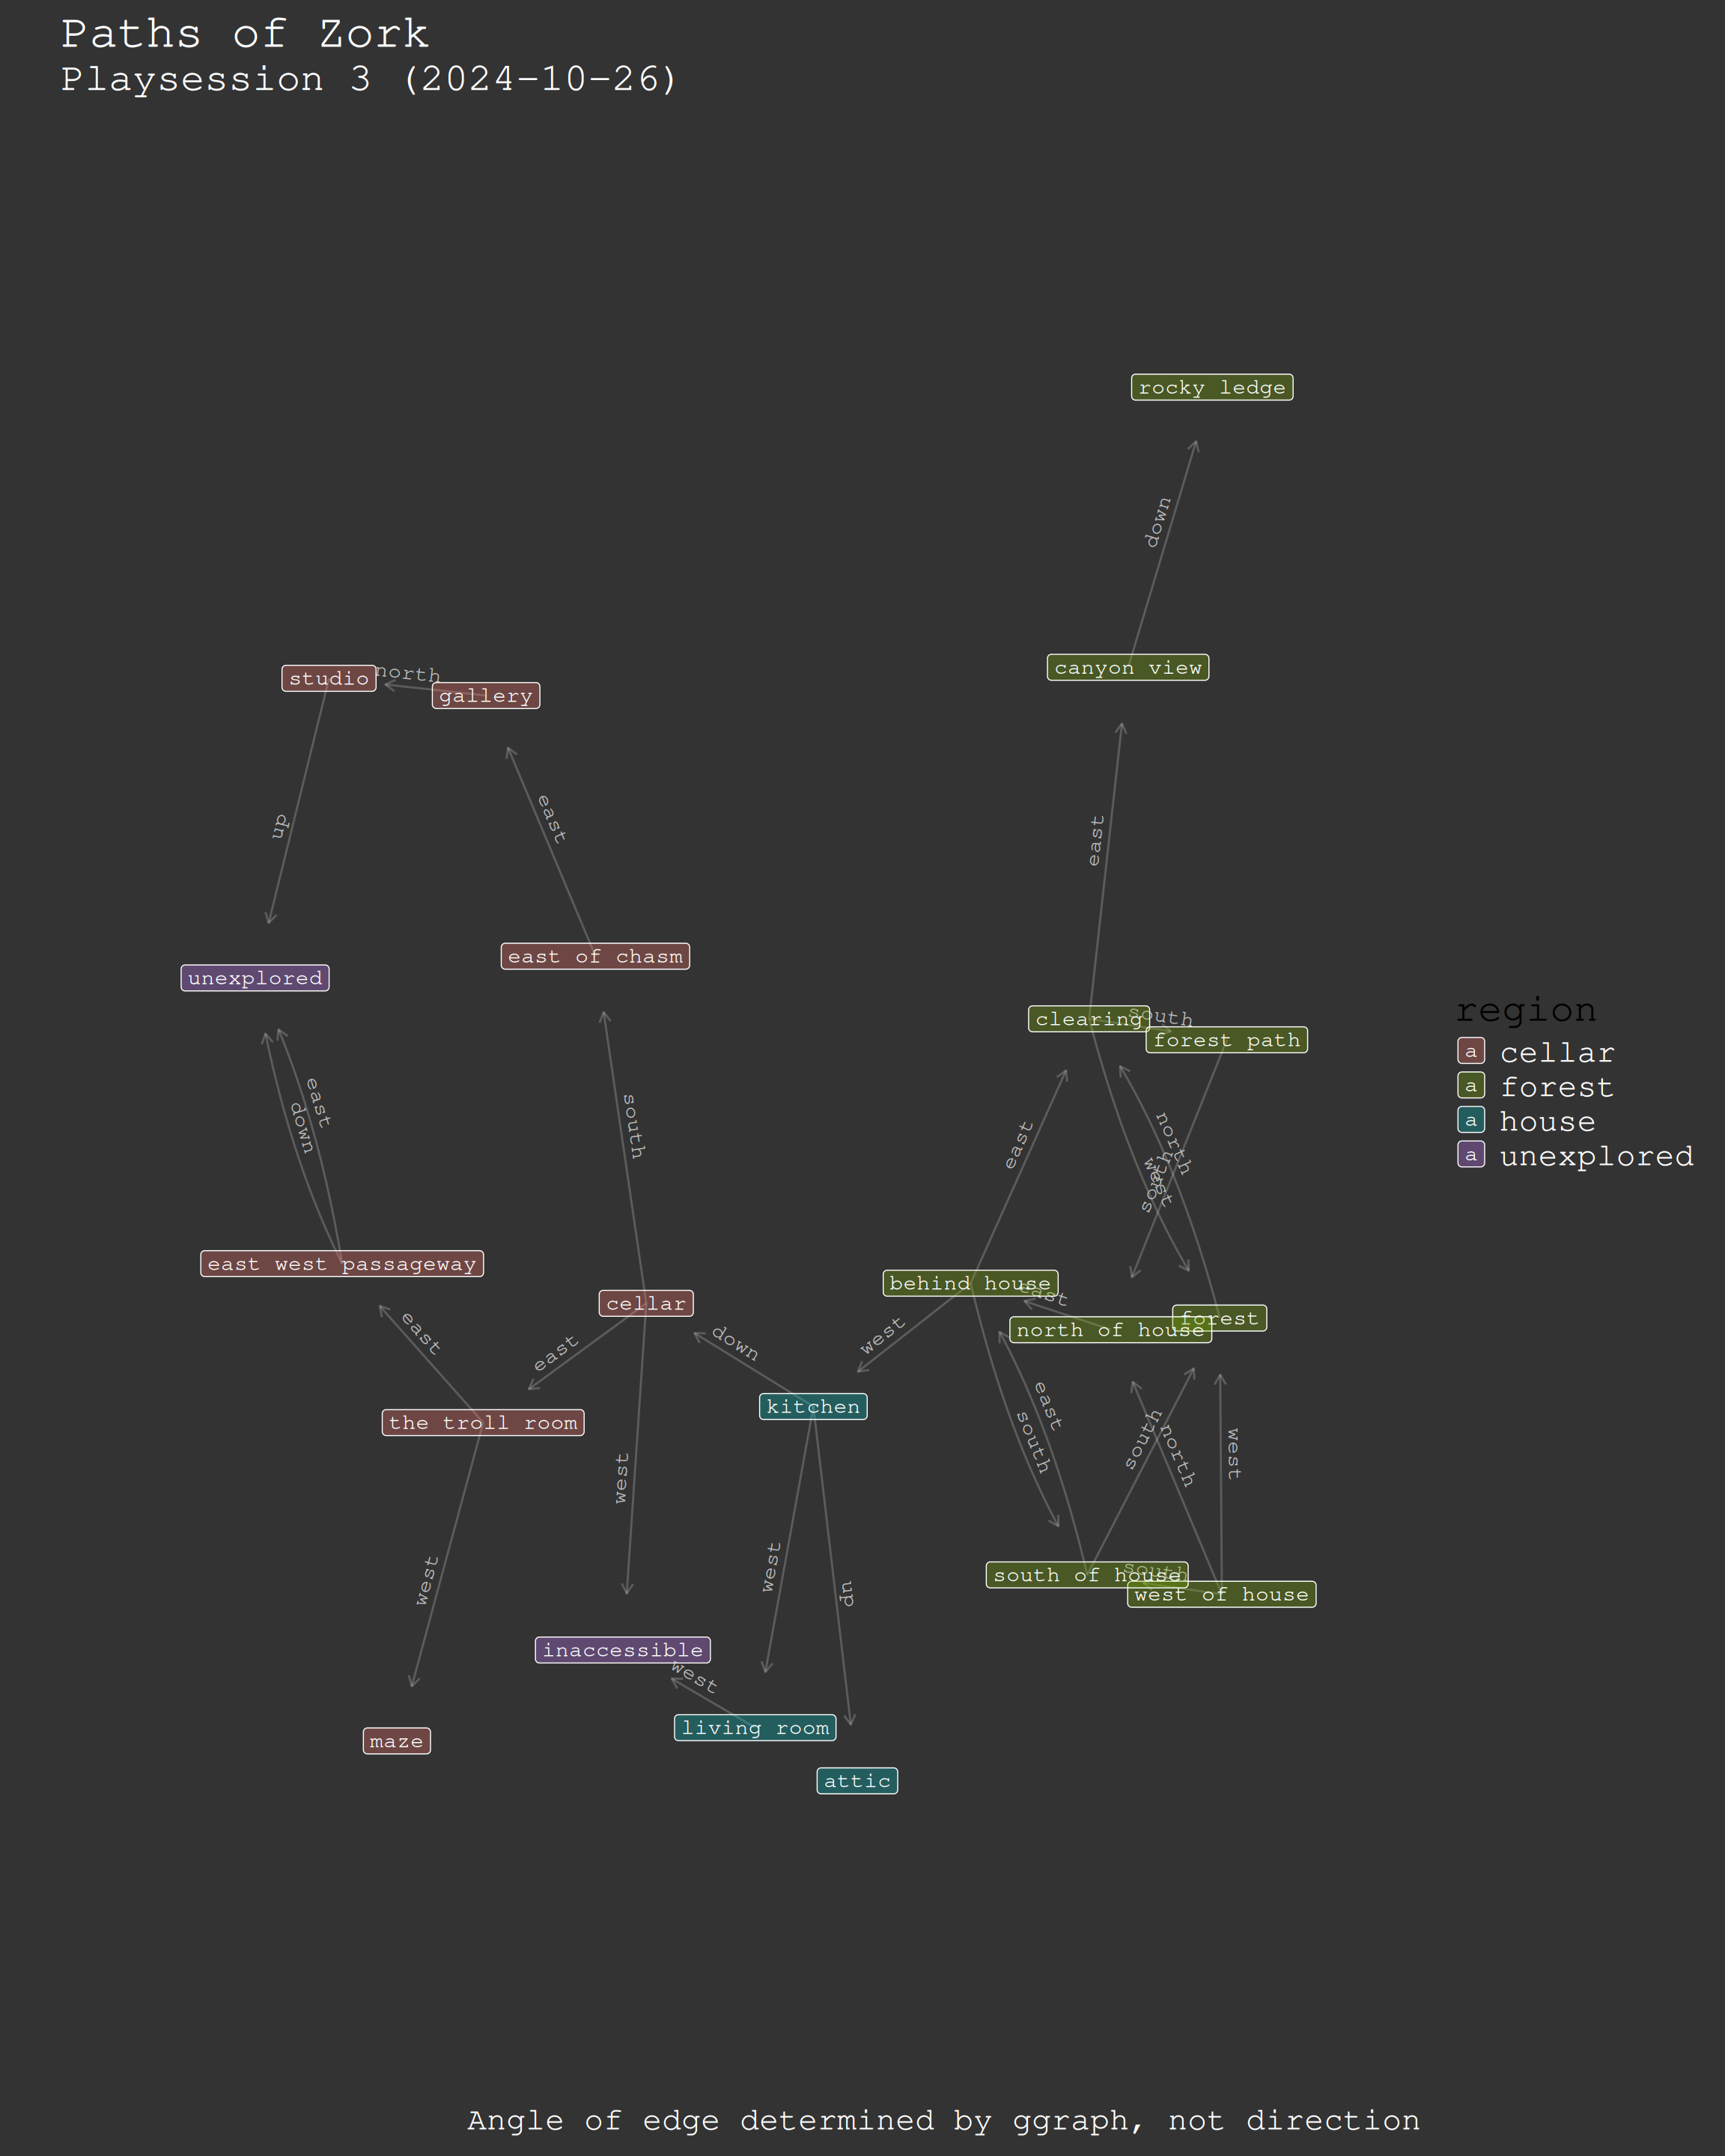
ggsave('2024-10-26--graph.png', dpi=1000)zork_paths(get_zork_graph(zork_edges, zork_nodes, 'cellar'))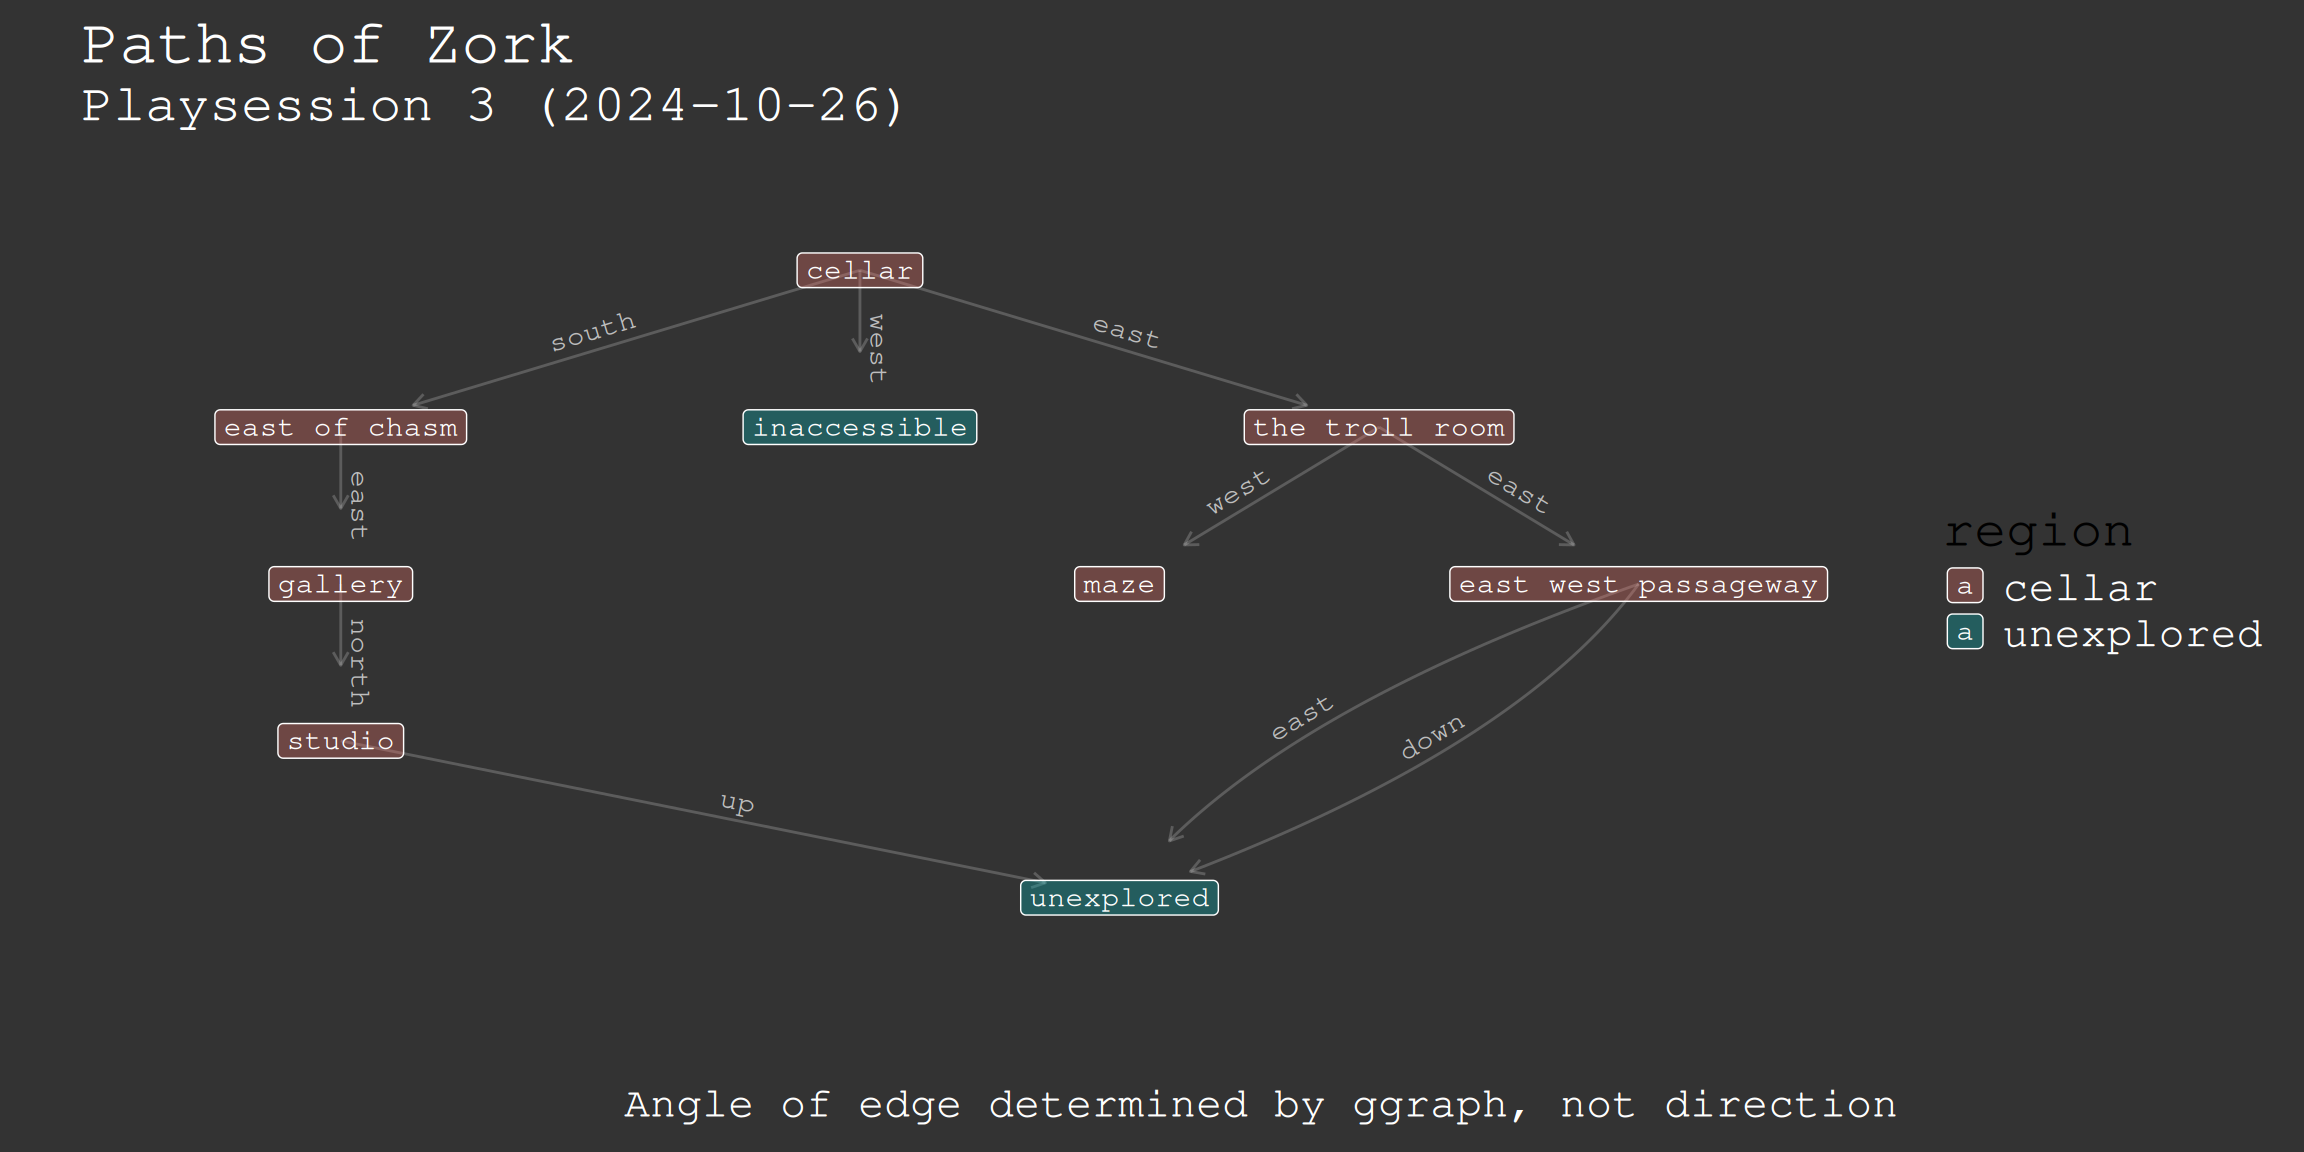
ggsave('2024-10-26--graph-cellar.png', dpi=1000)zork_paths(get_zork_graph(zork_edges, zork_nodes, 'forest'))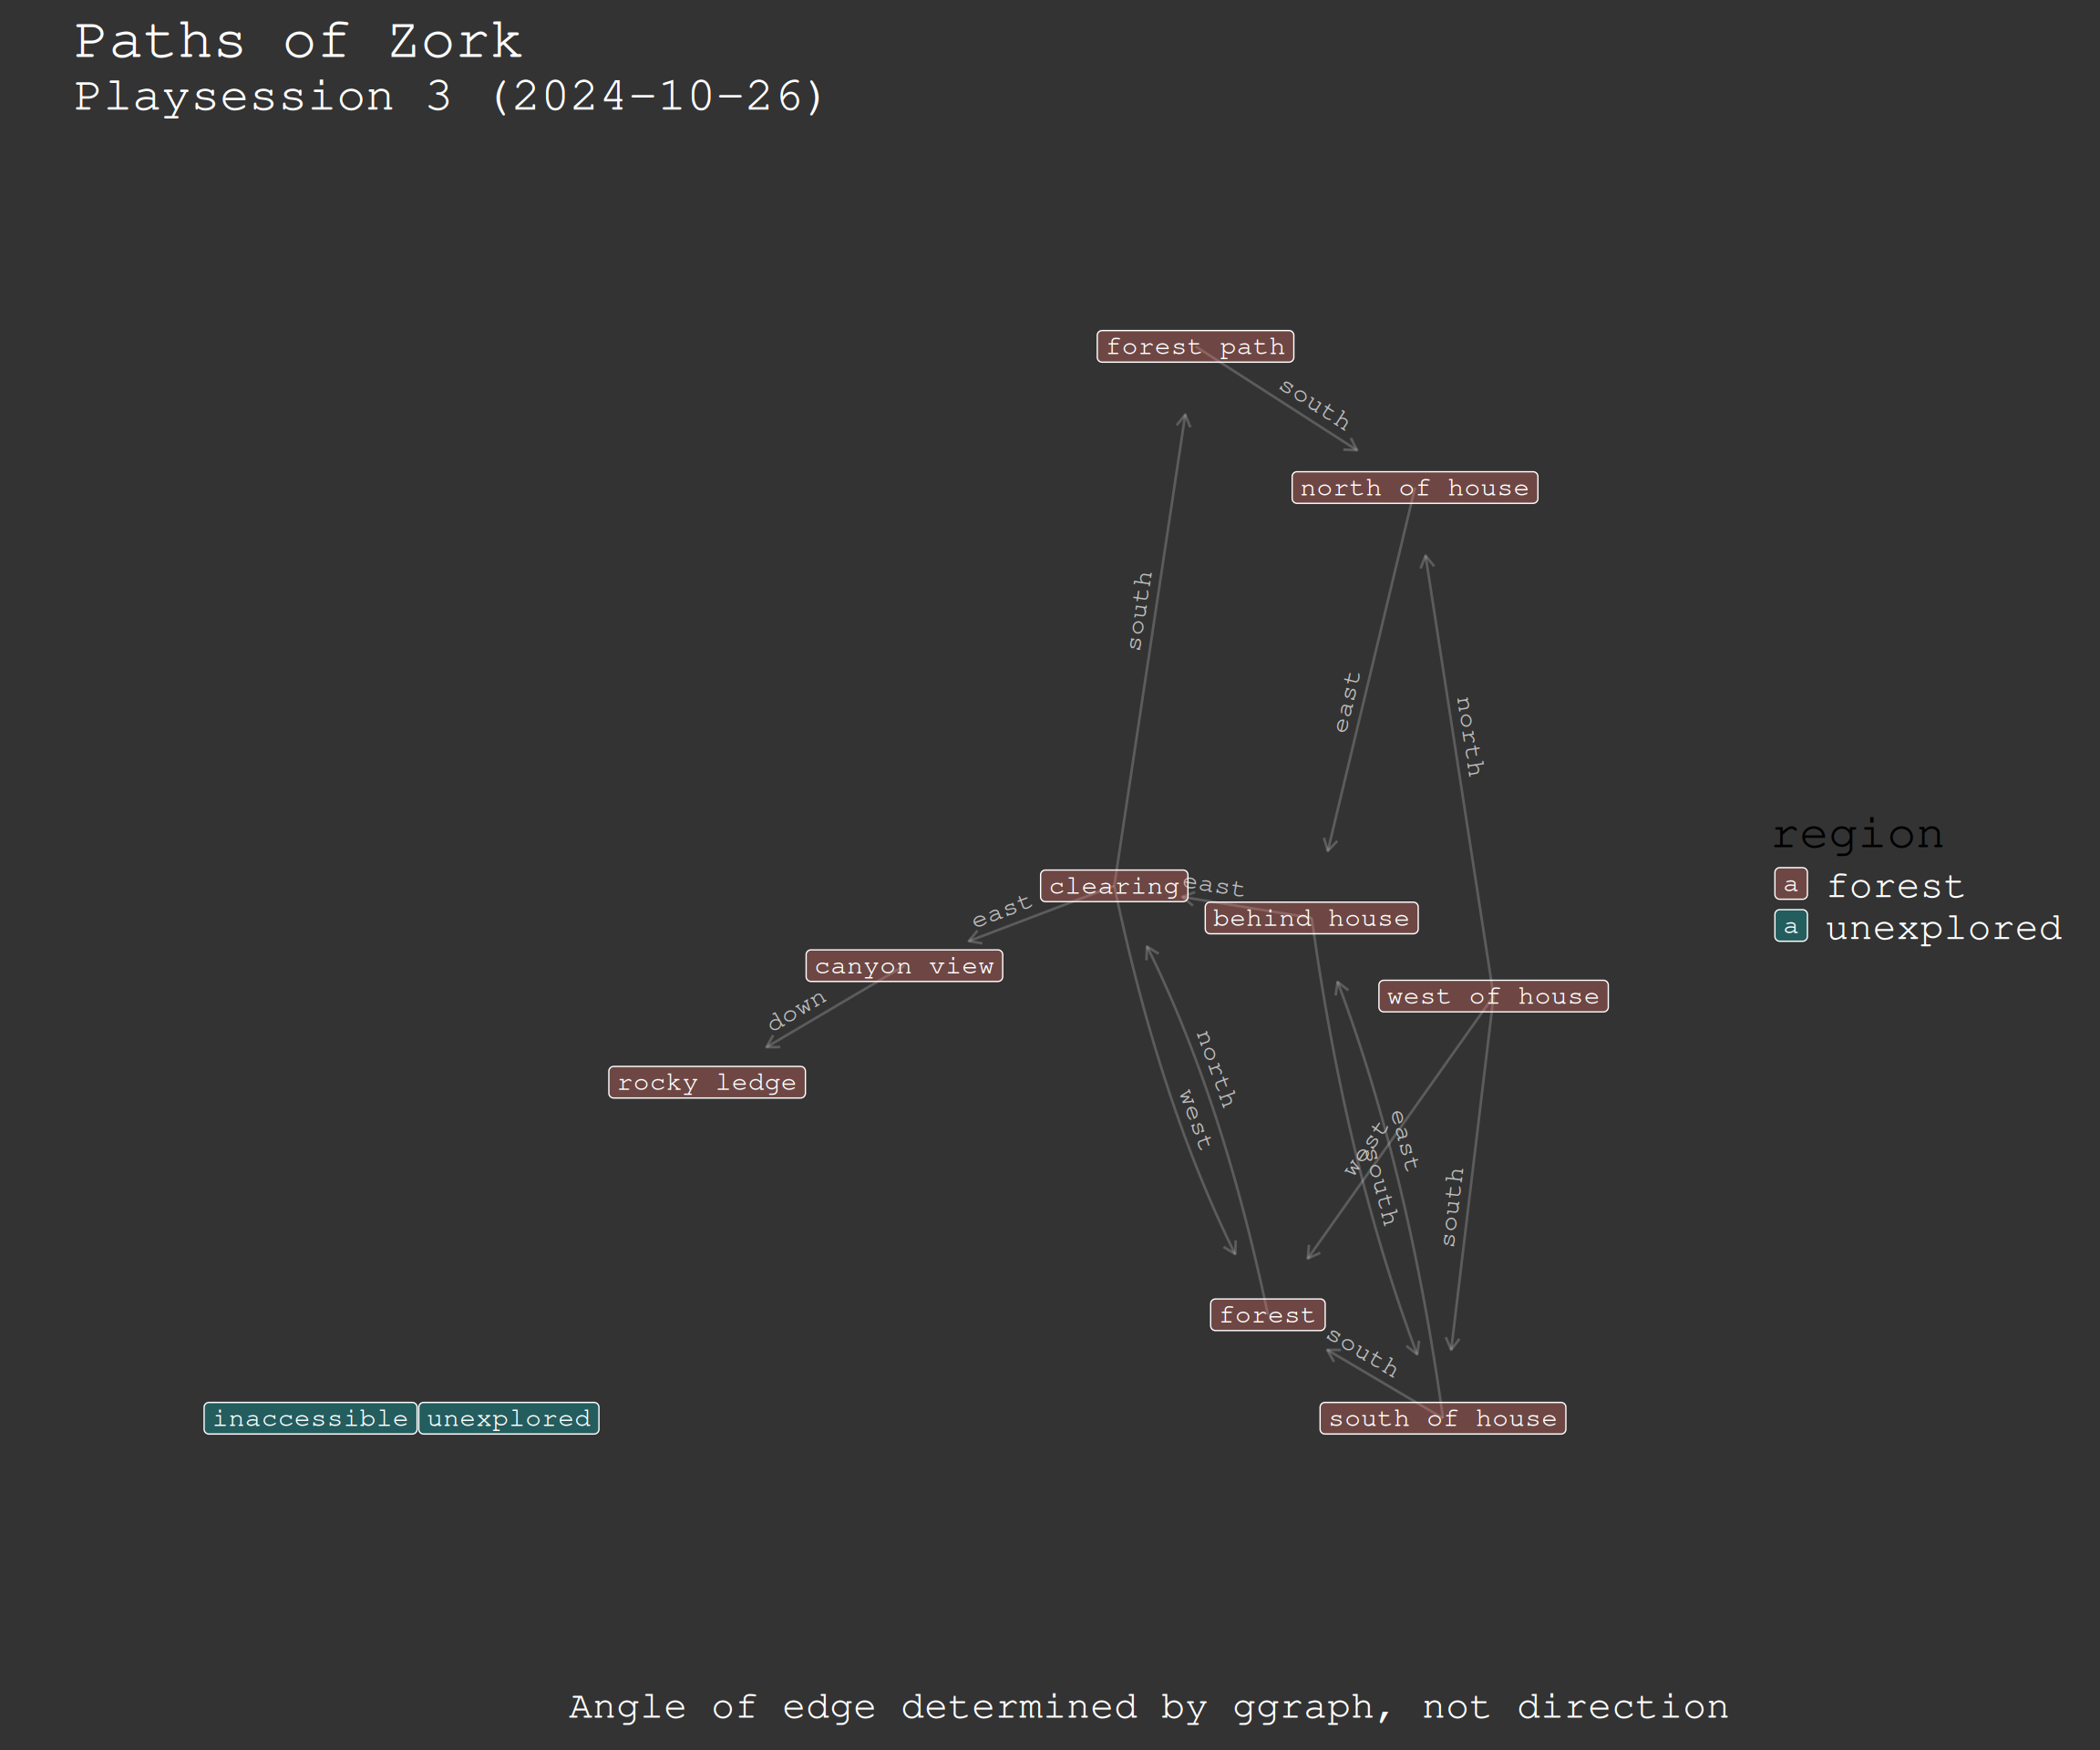
ggsave('2024-10-26--graph-forest.png', dpi=1000)library(gt)
zork_nodes |>
gt()| perspective_location | region | interactivity | loot |
|---|---|---|---|
| west of house | forest | solved: mailbox | leaflet |
| north of house | forest | none | none |
| forest | forest | song bird? | none |
| clearing | forest | unsolved: pile of leaves | none |
| forest path | forest | none | none |
| behind house | forest | window to house | none |
| south of house | forest | none | none |
| kitchen | house | sack | water, lunch, garlic |
| living room | house | rug, locked door to west | sword, lantern |
| attic | house | none | rope, knife |
| unexplored | unexplored | unknown | unknown |
| canyon view | forest | none | none |
| rocky ledge | forest | none | none |
| cellar | cellar | none | none |
| inaccessible | unexplored | none | none |
| east of chasm | cellar | none | none |
| gallery | cellar | painting | none |
| studio | cellar | note, 69 colours | none |
| the troll room | cellar | troll | none |
| maze | cellar | unknown | unknown |
| east west passageway | cellar | unknown | unknown |
Now to add rows and watch the plot update.
Next time will try using a google sheet and scraping it. Is too cumbersome coding. But will have to get workflow for setting levels of categorical variables.
Don’t want to proceed without fixing the data entry. Especially now that I’m switching to command line zork, so much better.
sudo snap install zorkwrite_tsv(zork_edges, ‘2024-10-26–edges.tsv’) write_tsv( zork_nodes, ‘2024-10-26–nodes.tsv’)
```54p