Next playsession was all about getting the graphs into a script. But for about an hour or so I did play, and it was so satisfying seeing the graph grow as I played and collected data points.
However, I knew my next playsession would need a better data capture system. First I tried a google sheet, but hit a wall trying to read the data from the url. I think I’ll give it another try, as I like the interface for input of categorical variables.
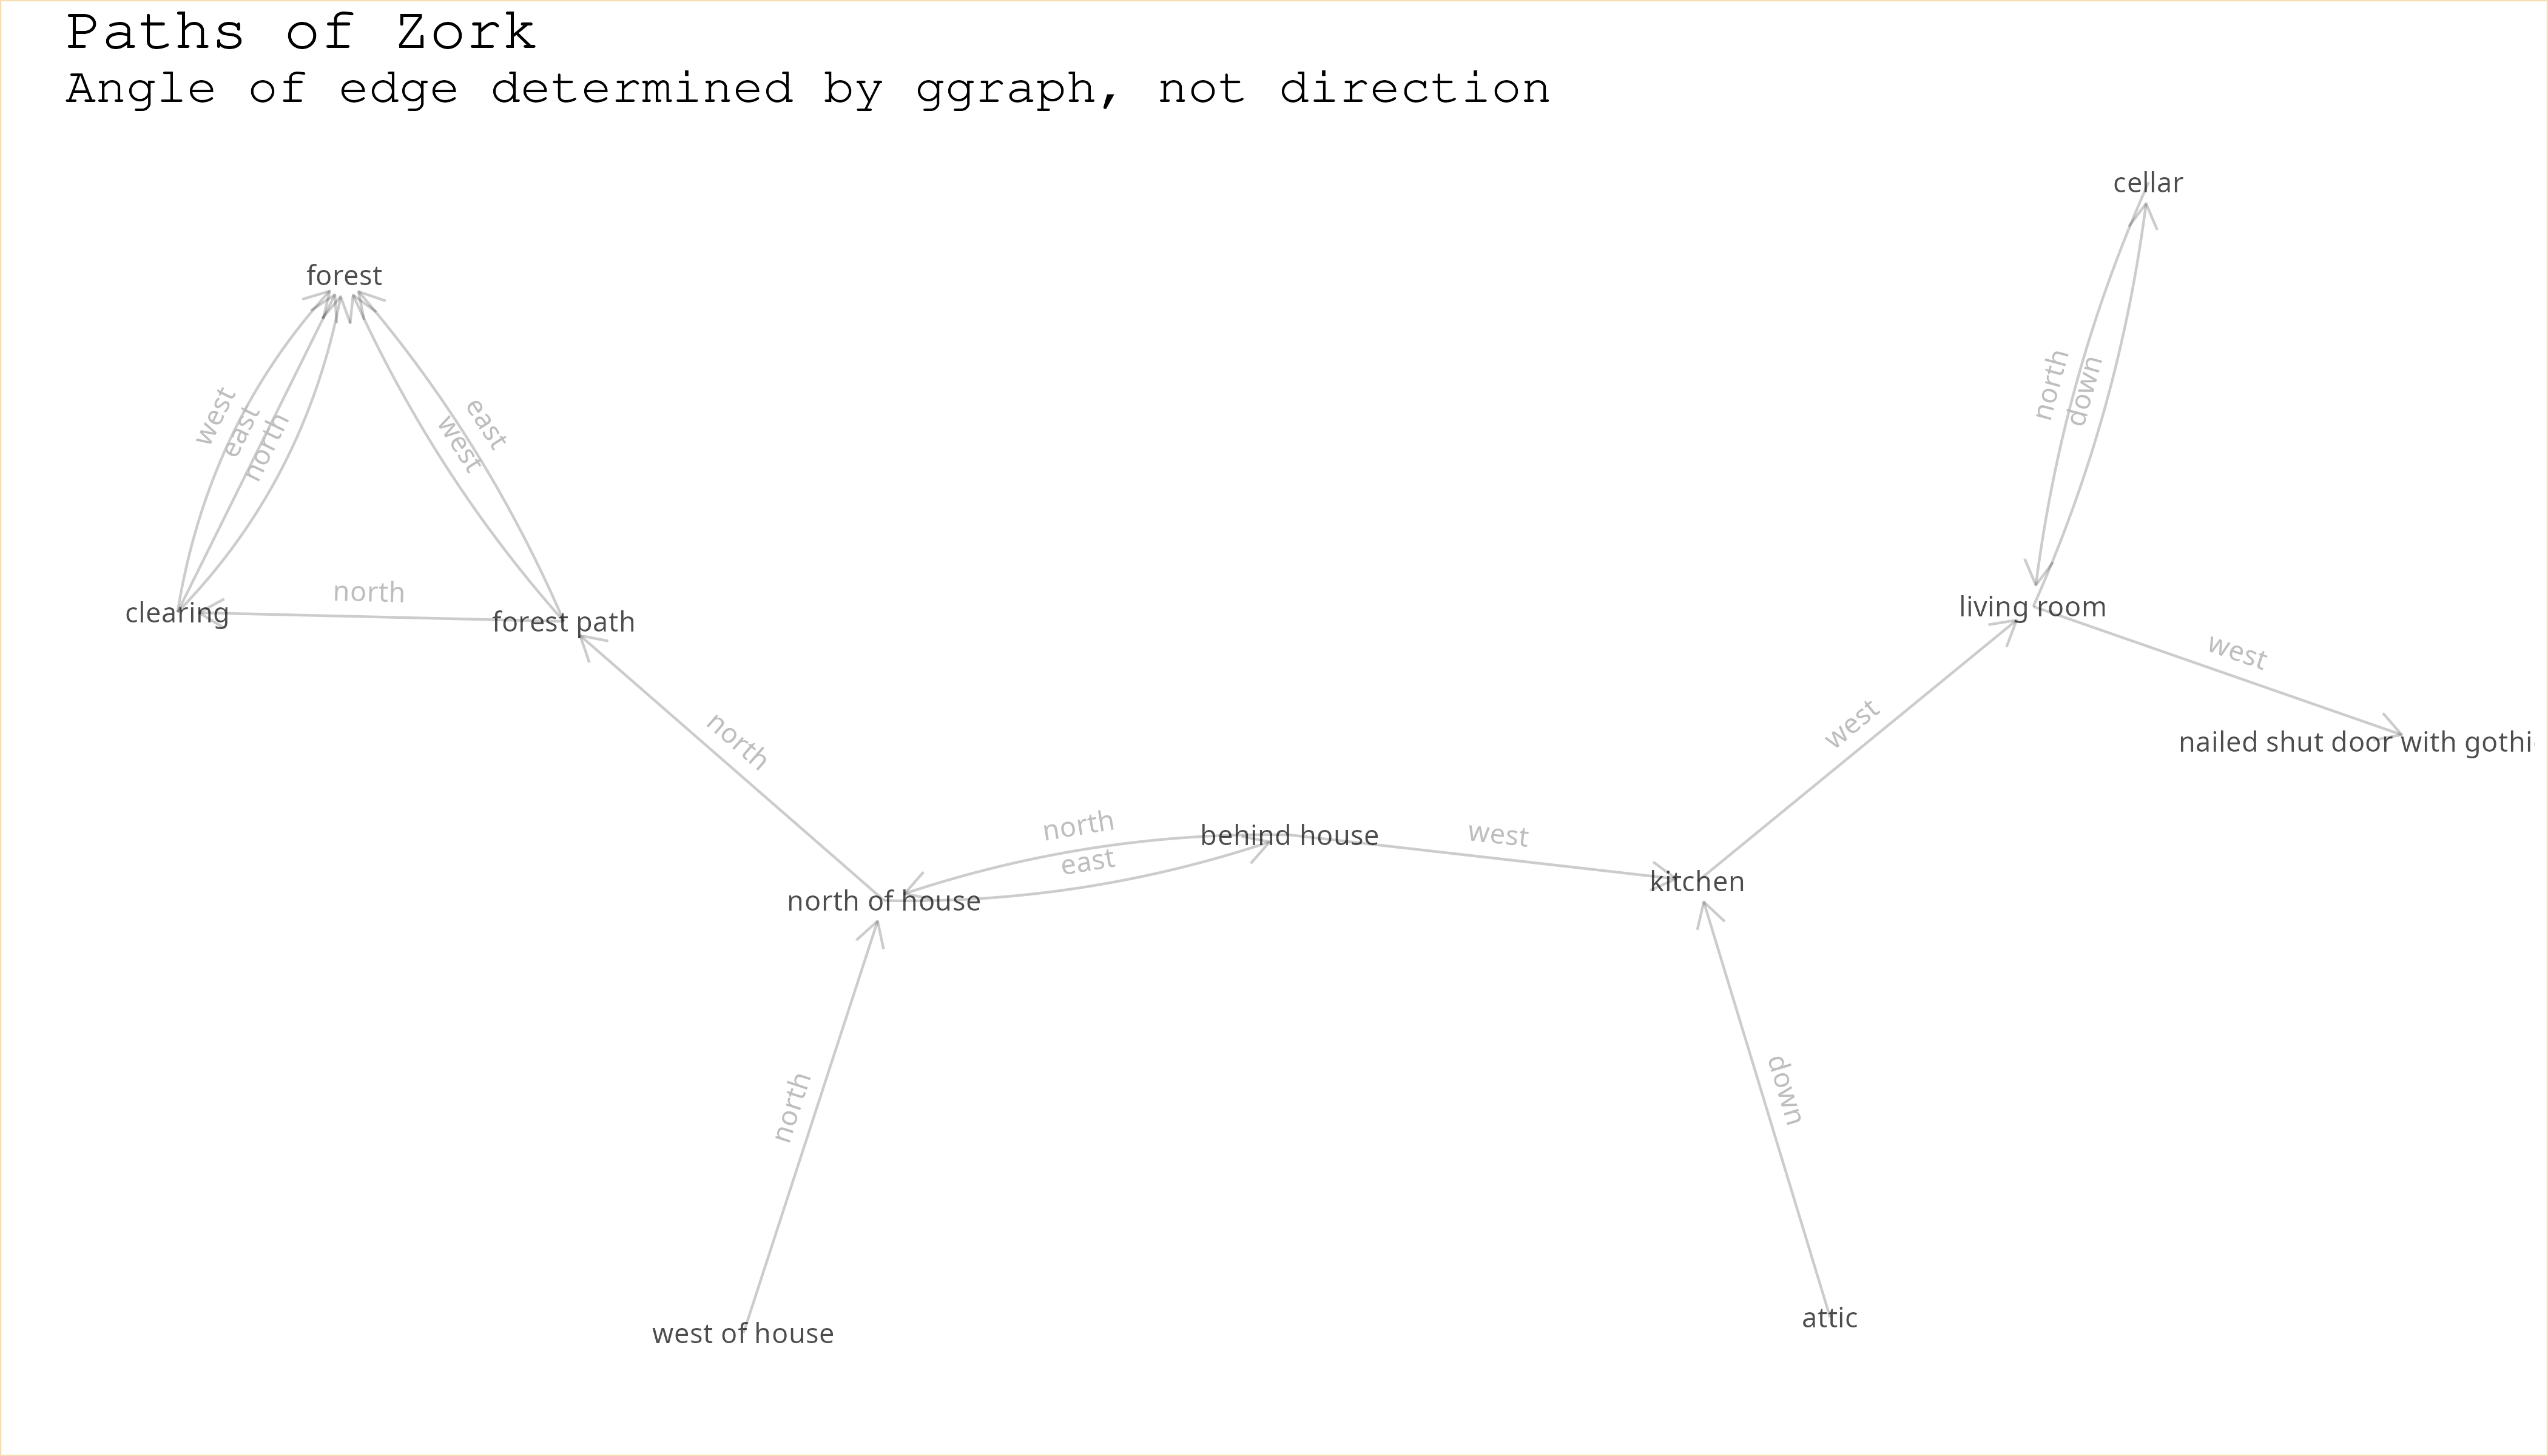
Of course, in the end, I went down a rabbit hole of prettifying the vis, and I’m reasonably happy with my efforts for one session.